Google PageSpeed Insights is an extremely useful tool for developers and it can provide a lot of information about exactly what your website is doing on a technical level. It’s very advanced and tends to focus on details that often have no bearing on reality. While looking at the results, if you don’t know which metrics matter you could end up spending days or weeks trying to “fix” things that will ultimately not help you solve the problem you originally wanted to solve.
Online Testing Tools can Get Complicated
Online tools like Google’s PageSpeed systems tend to provide a huge amount of information on different aspects of your site but usually only a couple of them actually do anything to explain why any given website is slow, and the terms it uses can be quite confusing. Starting with the very first summary it will put metrics like ‘Time to First Byte (TTFB)’ up there with other (much less) important metrics like ‘Cumulative Layout Shift’. It tends to put a lot of emphasis on details that have little to no bearing on how fast a site loads.
Unless you’re very familiar with each test performed, and what the results actually mean you could end up focusing on the wrong thing thinking that making all the bars ‘green’ would mean your site runs better.
The truth is, only a few of the numbers on those kinds of sites actually matter. For example, ‘Time to First Bit/Byte’ (TTFB) is a measure of how long it takes a web server to send anything back to a browser once a page request is sent. This is a huge factor in how responsive a website feels and it’s a good one to focus on if you’re trying to get your site to run faster in general.
There are hundreds of other little details that these kinds of broad-spectrum testing tools look at. Not all of the information it looks at or provides is related to the direct speed of the site servers. Some of it is related to analyzing how often your browser has to work to show you the site, with information on how many times the content of your site gets ‘repainted’ (or moved around), and how much processing time is required to handle javascript embedded into your site. These tests are aimed at showing how the site would perform on lower-power devices.
Other categories of performance focus on the overall size of the site to see how it would perform on lower-bandwidth connections. This includes measuring how big your images are, or looking at how much extra information has to be transmitted before the site will look proper. These kinds of metrics are usually only useful if you want the site to load well or quickly on devices with much much slower internet connections.
Accuracy is a Problem…
One major issue is the test results themselves aren’t consistent. PageSpeed Insights tries to get around this by averaging a bunch of user-provided site metrics, generally trying to give you an idea of what the ‘average’ visitor to your site had. This ultimately means that the results aren’t really going to reflect your site as it is *now* if it had performance issues recently, or if you’ve made some changes to improve things.
Not all metrics are crowdsourced though. Some of the information tools like these provide are the result of direct connections from the testing tool to your website, and that has a host of other possible issues.
First, you have no idea how busy the testing server is. If it’s busy, it can take longer to run benchmarks. The internet health between the testing server and your website can also sometimes impact test results.
This means you could run the same test multiple times only minutes or hours apart and get wildly different results!
Even Google knows this…
There’s a fun note buried in the documentation for their tools that mentions there’s no real correlation between most of the metrics, and how fast your site actually is. A large part of the problem is that ultimately these kinds of tools are robots and they don’t look at your website the same way a human does.
Robots, and other search engines, are generally focused on getting in, getting the content indexed and getting out as fast as possible. Test tools can simulate how a browser would respond to a website request and page paint, but they’re not looking to see how a website feels. They can guess but sometimes they get it wrong.
All checks are automated, and not all automated tests even apply to your site. If you want a laugh, try telling Google PageSpeed Insights to analyze Youtube.com.
Not even some of the biggest and best websites on the internet have very good scores.
But my Website is Still Slow…
There are a lot of possible reasons a website would be slow. If you know what you’re doing, you can still use tools like PageSpeed Insights to get some hints, but really your own browser already comes with most of the tools you need built in. Firefox, Edge, Chrome, and just about every other browser in use on modern computers these days comes with a developer menu. In almost every case, you can access it by pressing the ‘f12’ key.
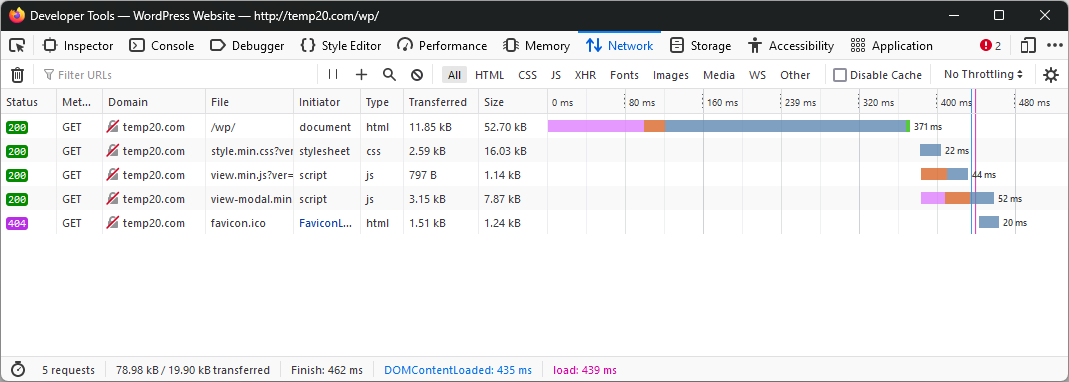
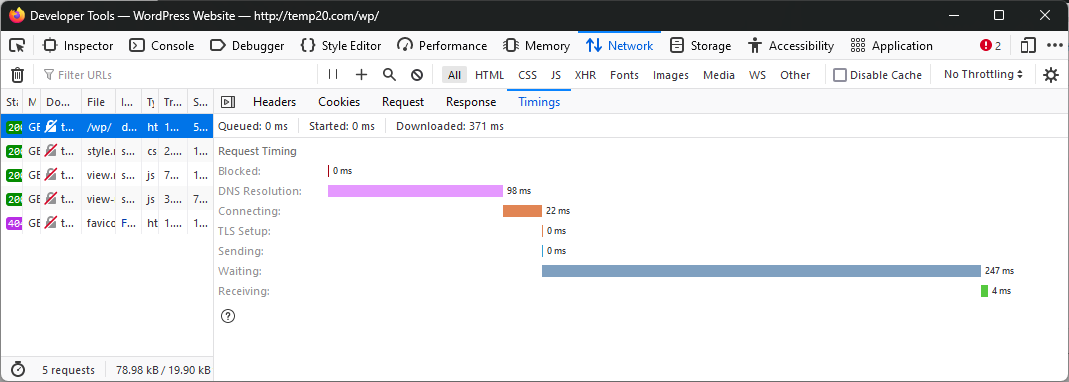
The developer menu has a lot of tools for site debugging and development, but the one I want to highlight today is the ‘Network’ tab. If you open that and then load your website, it will show a ‘waterfall’ graph of every single request your browser made while loading that website, and the timelines will also draw a bar across the waterfall showing when certain major events in the page load occurred.
Depending on exactly what took so long, you can use that kind of information to choose how to proceed.
WordPress can be a Monster
WordPress is wildly popular and in wide use. It’s used so much, that many tools installed on our hosting are tailored specifically for it. There are limits though. WordPress on its own is pretty lightweight, but adding even a few plugins can bog it down considerably. Doing this raises the resource demands for the server hosting your installation and it’s pretty easy to end up in a situation where your site is bigger than your hosting plan.
We actually built a new series of WordPress Hosting packages at HostUpon just for this. Our ‘Plus’ series of hosting packages feature increased CPU access times, and full-SSD storage for all site content, which greatly reduces the load times for sites using it.
Information on these packages can be found here.
We Have Diagnostic Tools Too!
If your site is hosted with HostUpon, and if it’s a WordPress site, we have extra tools we can run on the server-side of the connection that breaks down one of the most important metrics for page response: Time to First Bit.
Using our PHP X-Ray tools, it is possible for us to break down processing delays on the server side of the connection. It works by taking the entire PHP processing time, and breaking it down plugin by plugin, showing how much CPU time was used by each plugin while handling your page request.
Just contact our Support department if you want us to run this free WordPress speed assessment for you.
Even if your site isn’t WordPress, as the host we have access to a lot of information about what your site does server-side during a page request. For example, we can tell if a script malfunctions and just never loads at all, and we can also tell if an overload condition is underway due to too much traffic, and we usually have a recommendation or two on how to fix it.
Final Words
If your site loads fine for you, and you have no complaints about the speed of your site or how responsive it is, then you can usually ignore any PageSpeed Insights results that say otherwise.
If you are trying to diagnose or fix a performance issue, I’d start with your browser’s built-in diagnostics, and only use the results of online testing tools if you really understand exactly what each individual diagnostic result means.
The test results may contain a lot of useful information but just like any other advanced diagnostic tool, if you don’t know how to interpret the results you could do more damage than good!


Add comment